scRNAseq data are derived from Ribonucleic Acid (RNA) molecules that have been isolated from individual cells of a biological sample (e.g. cell culture, tissue, organ, or whole organism) then reverse transcribed into complimentary Deoxyribonucleic Acid (cDNA) and prepared as libraries to be sequenced on a next generation sequencing platform. By assigning a unique barcode to the RNA in each cell, researchers can identify and quantify gene expression in each individual cell. This procedure is highly valuable because it allows for characterization of the gene expression patterns in diverse cell populations, such as specific cell types (e.g. normal cells vs. cancer cells), or cells at different stages of differentiation and development.
scRNAseq is often compared to bulk RNAseq, in which a biological sample is homogenized and the RNA molecules from all cells are combined together. While bulk RNA-seq is also very useful, it does lack the single-cell resolution of scRNAseq. Bulk RNAseq can be compared to a fruit smoothie, where all the fruit is mixed together indiscriminately, while scRNAseq can be compared to a fruit salad, where individual fruit pieces can be picked out and identified.
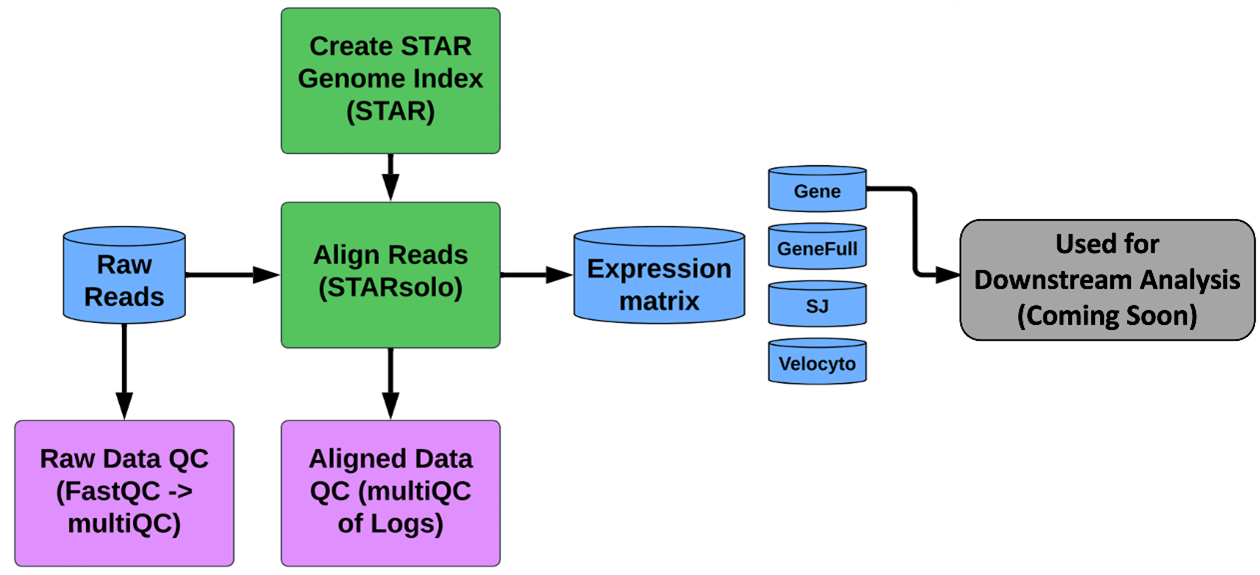
The GeneLab scRNAseq consensus processing pipeline, is designed to determine how gene expression changes (i.e. which genes are turned on, turned off, or stay the same) in individual cells and how cell populations change when living organisms are exposed to the space environment. The pipeline used to process scRNAseq data depends on the method used to generate those data. GeneLab has developed a standardized pipeline for processing raw scRNAseq data prepared using the 10X Chromium 3’ kit through generation of raw gene counts per cell as summarized in the diagram above. Specific details of each step of the pipeline, including previous and current pipeline versions, are available on the scRNAseq page of the GeneLab DP GitHub Repository.
The primary data products and respective quality control (QC) analyses generated from each step of the pipeline, as described below, are available for each GeneLab scRNAseq dataset hosted on the OSDR under ‘Study Files’. Note that filtered gene expression data provided in the Gene.zip file indicated below will be used for cell clustering, cell-type identification, and differential gene expression (DGE) analysis, which is currently in development and will be made available as part of the GeneLab interactive visualization portal. Below are the scRNAseq data files that are published:
Raw sequence data and QC
- *raw.fastq.gz: Raw sequence data, commonly referred to as raw reads
- *raw_multiqc_report.zip: Combined fastQC analyses and respective html report of raw sequence data
Aligned sequence data and QC
Note: Unlike bulk RNAseq, for scRNAseq read trimming and quality filtering is performed as part of the STARsolo alignment step of the pipeline.
- *Aligned.bam: Sequence alignment map containing reads mapping to the Ensembl reference genome, in binary format
- *SJ.out.tab: Tab-deliminted file containing high confidence collapsed splice junctions and respective count data
- *Log.final.out: Log file containing alignment info/stats such as the number of uniquely mapped reads and multi-mapped reads
- *align_multiqc_report.zip: Combined alignment info/stats data from each sample and respective html report
STARsolo counts data and QC
- *Barcodes.stats: Barcode statistics
- *Gene.zip: Compressed directory containing the following outputs generated from the `Gene` soloFeatures setting, which counts for gene transcriptomic features:
- Features.stats: Quantified features statistics
- Summary.csv: Table containing summary statistics for filtered cells
- UMIperCellSorted.txt: List of the number of UMIs per cell sorted
- /raw: Sub-directory containing the following output files for raw, unfiltered, expression data:
- barcodes.tsv: Table containing all barcodes processed
- features.tsv: Table containing all gene IDs and symbols
- matrix.mtx: Table containing the unique-gene UMI raw counts
- UniqueAndMult-EM.mtx: Table containing the sum of unique+multi-gene UMI counts
- /filtered: Sub-directory containing the following output files for filtered expression data (these files will be used for subsequent cell clustering, cell-type identification, and DGE analysis):
- barcodes.tsv: Table containing remaining barcodes after filtering
- features.tsv: Table containing remaining gene IDs and symbols after filtering
- matrix.mtx: Table containing the unique-gene UMI filtered counts
- *GeneFull.zip: Compressed directory containing the following outputs generated from the `GeneFull` soloFeatures setting, which counts for other transcriptomics features (e.g. pre-mRNA counts) in addition to gene counts:
- Features.stats: Quantified features statistics
- Summary.csv: Table containing summary statistics for filtered cells
- UMIperCellSorted.txt: List of the number of UMIs per cell sorted
- /raw: Sub-directory containing the following output files for raw, unfiltered, expression data:
- barcodes.tsv: Table containing all barcodes processed
- features.tsv: Table containing all gene IDs and symbols
- matrix.mtx: Table containing the unique-gene UMI raw counts
- UniqueAndMult-EM.mtx: Table containing the sum of unique+multi-gene UMI counts
- /filtered: Sub-directory containing the following output files for filtered expression data:
- barcodes.tsv: Table containing remaining barcodes after filtering
- features.tsv: Table containing remaining gene IDs and symbols after filtering
- matrix.mtx: Table containing the unique-gene UMI filtered counts
- *SJ.zip: Compressed directory containing the following outputs generated from the `SJ` soloFeatures setting, which counts for annotated and novel splice junctions:
- Features.stats: Quantified features statistics
- Summary.csv: Table containing summary statistics for filtered cells
- /raw: Sub-directory containing the following output files for raw, unfiltered, expression data:
- barcodes.tsv: Table containing all barcodes processed
- features.tsv: Table containing all gene IDs and symbols
- matrix.mtx: Table containing the raw counts for annotated and novel splice junctions
- *Velocyto.zip: Compressed directory containing the following outputs generated from the `Velocyto` soloFeatures setting, which will calculate spliced, unspliced, and ambiguous counts per cell per gene:
- Features.stats: Quantified features statistics
- Summary.csv: Table containing summary statistics for filtered cells
- /raw: Sub-directory containing the following output files for raw, unfiltered, expression data:
- barcodes.tsv: Table containing all barcodes processed
- features.tsv: Table containing all gene IDs and symbols
- ambiguous.mtx: Table containing the raw ambiguous counts per cell per gene
- spliced.mtx: Table containing the raw spliced counts per cell per gene
- unspliced.mtx: Table containing the raw unspliced counts per cell per gene