Microarray data are derived from Deoxyribonucleic Acid (DNA) molecules that have been isolated from a biological sample (e.g. individual cells or nuclei, cell culture, tissue, organ, or whole organism) or Ribonucleic Acid (RNA) molecules that have been isolated from a biological sample then reverse transcribed into complementary Deoxyribonucleic Acid (cDNA). The nucleotides isolated from each sample are subsequently tagged with a color-specific fluorescent dye and then allowed to hybridize to probes, short sequences of DNA corresponding to a known target gene, that are attached to a specific location within an array on a slide (commonly referred to as a DNA microarray). If the sample was expressing a known target gene, its tagged DNA or cDNA will hybridize to the respective gene probe(s) and emit a color-specific fluorescent signal upon excitation, which is detected by scanning and photographing the microarray slide. The signal intensity correlates with the degree of hybridization and therefore enables indirect measurement of gene expression. Processing of DNA microarray data is dependent on how the samples were prepared, how the microarray was designed, and the scanning system used to collect the raw data, which are all specific to different microarray platforms.
Some common uses of microarray data include:
- identifying genes expressed in biological samples
- determining how gene expression changes in biological samples in response to a treatment and/or across environmental gradients or time
- studying protein-gene interactions (when coupled with Chromatin immunoprecipitation, ChIP)
- evaluating genetic mutations in biological samples
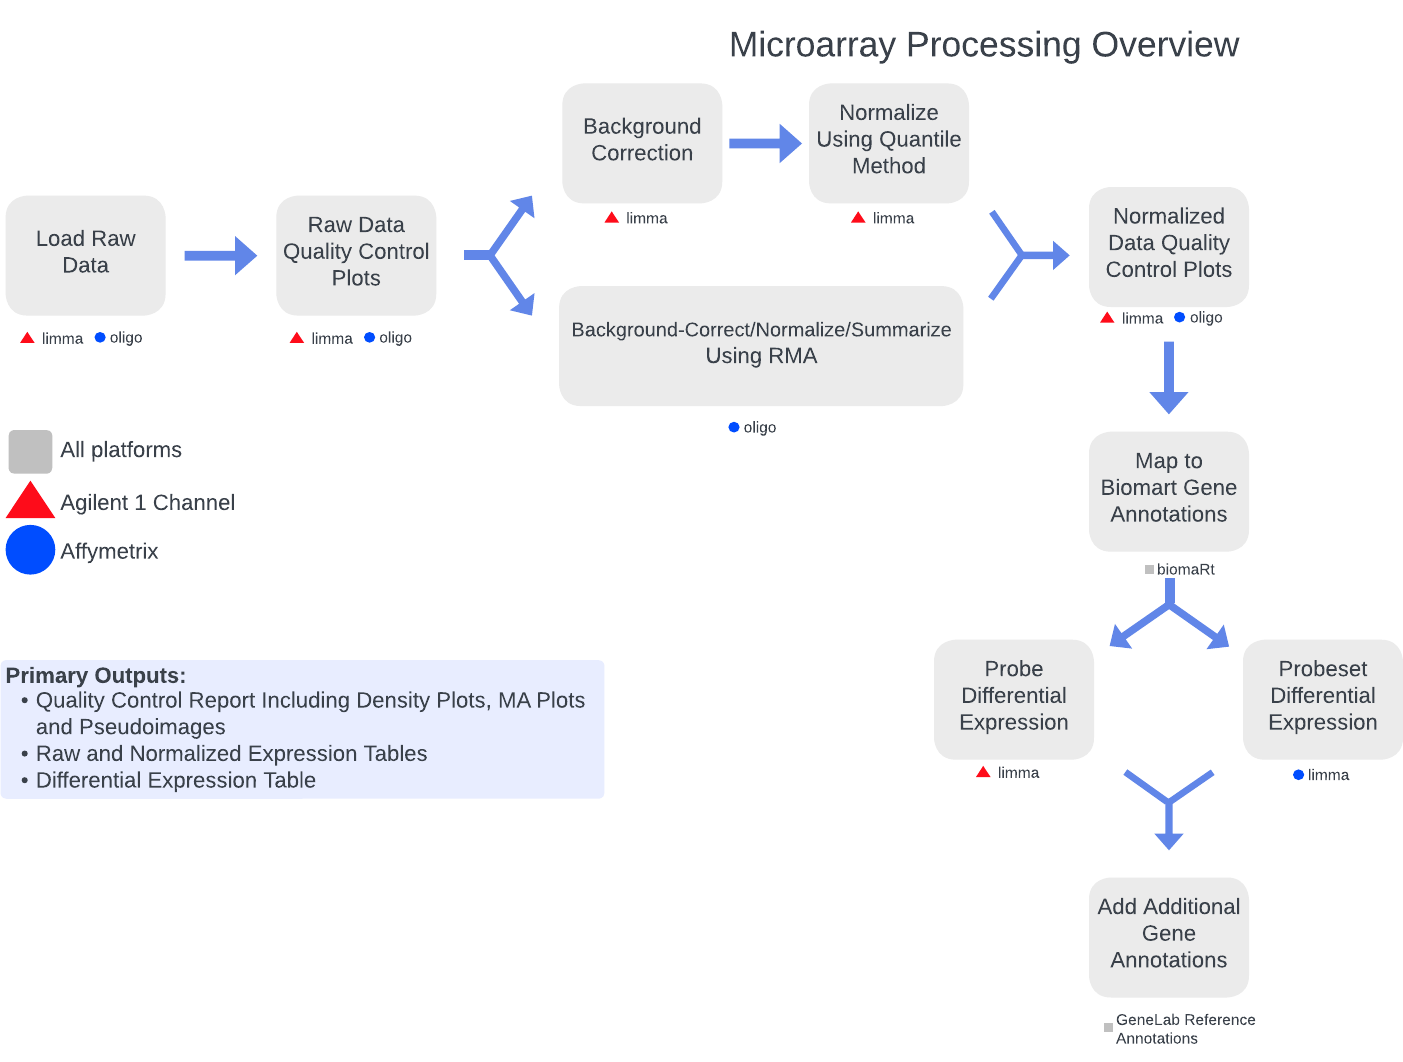
The GeneLab microarray consensus processing pipelines for microarray data generated from Agilent 1-channel and Affymetrix platforms, are designed to determine how gene expression changes (i.e. which genes are turned on, turned off, or stay the same) when living organisms are exposed to the space environment by processing raw microarray data through differential gene expression as summarized in the diagram above. Specific details of each step of the pipelines, including previous and current pipeline versions, are available on the Microarray page of the GeneLab DP GitHub Repository.
The primary data products and respective quality control (QC) analyses generated from each step of the pipeline, as described below, are available for each GeneLab Agilent 1-channel and Affymetrix microarray dataset hosted on the OSDR under ‘Study Files’. Below are microarray data files that are published:
Metadata required for processing
- *runsheet.csv: Table containing the metadata from each sample required for processing
Raw expression data
Agilent 1-channel
- *raw_intensities.csv: Table containing the Limma (normexp method) background corrected, unnormalized intensity values for each sample including gene annotations
Affymetrix
Normalized expression data
Agilent 1-channel
- *normalized_expression.csv: Table containing the background corrected, Limma (quantile method) normalized intensity values for each sample including gene annotations
Affymetrix
- *normalized_intensities_probe.csv: Table containing the background corrected, Oligo (quantile method) normalized probe intensity values for each sample including gene annotations. The ProbeID is the unique index column
- *normalized_expression_probeset.csv: Table containing the background corrected, Oligo (quantile method) normalized and Oligo (rma, summarized) probeset expression values for each sample including gene annotations. The ProbesetID is the unique index column
Differential expression analysis data
Agilent 1-channel
- *SampleTable.csv: Table containing sample names and their respective groups
- *contrasts.csv: Table containing all pair-wise group comparisons
- *differential_expression.csv: Table containing normalized probe expression values for each sample, group statistics, Limma (lmFit) probe differential expression (DE) results for each pairwise comparison, and gene annotations
Affymetrix
- *SampleTable.csv: Table containing sample names and their respective groups
- *contrasts.csv: Table containing all pair-wise group comparisons
- *differential_expression.csv: Table containing normalized probeset expression values for each sample, group statistics, Limma (lmFit) probeset differential DE results for each pairwise comparison, and gene annotations. The ProbesetID is the unique index column
Processing info and QC
- *NF_MAAgilent1ch_*html (for Agilent 1-channel) or * NF_MAAffymetrix_*html (for Affymetrix): HTML report of R markdown used to process the specific Agilent 1-channel or Affymetrix microarray dataset, contains the following information:
- Exact processing information for each step of the pipeline
- The following quality assurance (QA) plots for raw and normalized probe expression data:
- Density plot
- Pseudo image plots
- MA plots
- Foreground-Background plots (only for Agilent 1-channel raw data)
- Boxplots of log2 intensity values