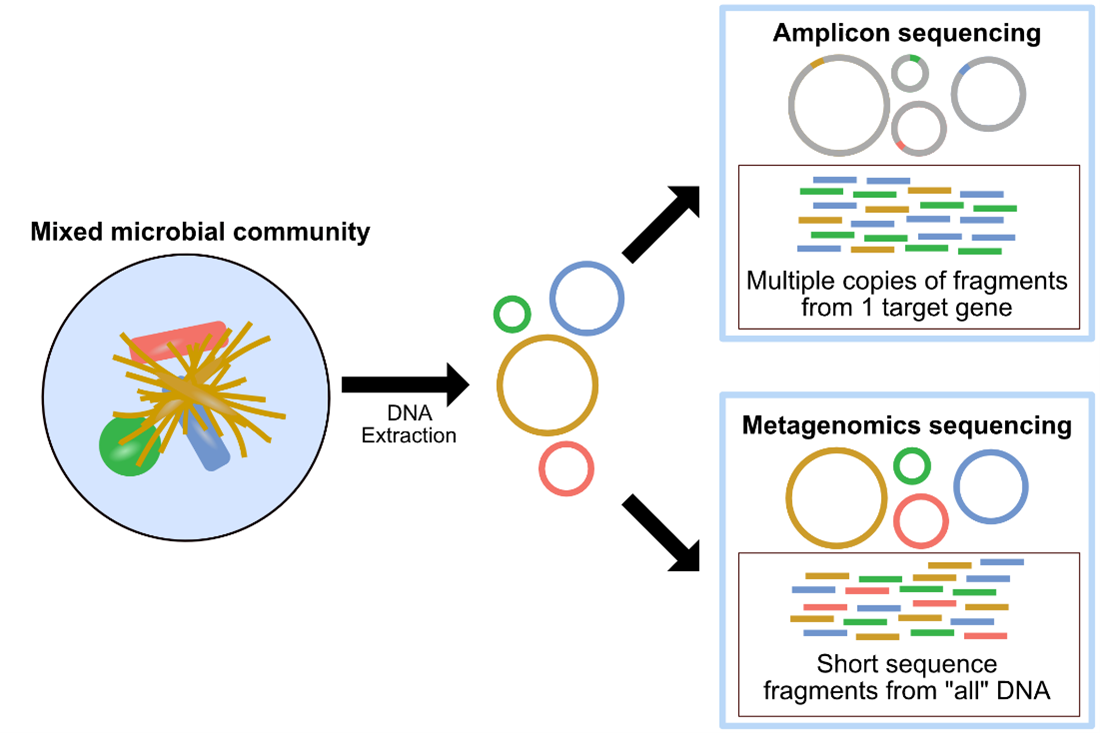
Metagenomics and Amplicon sequencing are two commonly used approaches in microbial ecology. The image above, also found here, provides a summary of metagenomics versus amplicon sequencing methodologies.
Metagenomics, or shotgun metagenomic sequencing, aims to amplify all the accessible DNA of a mixed community. Subsequent analysis of metagenomic sequence data provides a window into the taxonomy and functional potential of a sample. Metagenomics also enables the potential recovery of Metagenome-Assembled Genomes (MAGs). A MAG is typically different than an isolate genome and is more like a reconstructed representative genome of a very closely related microbial population, which could match an existing isolate or represent a novel isolate, that was in the microbial system sampled. The recovery of MAGs has become a powerful approach in microbial ecology, drastically expanding the known Tree of Life by granting us genomic access to as-yet unculturable microbes (e.g., Hug et al. 2016; Parks et al. 2017).
Some common uses of metagenomics data include:
- providing information on taxonomy and functional potential within a mixed community
- tracking changes in taxonomy and functional potential within a mixed community in response to a treatment and/or across environmental gradients or time
- enabling insight into the genomes of as-yet unculturable and/or undescribed microbes
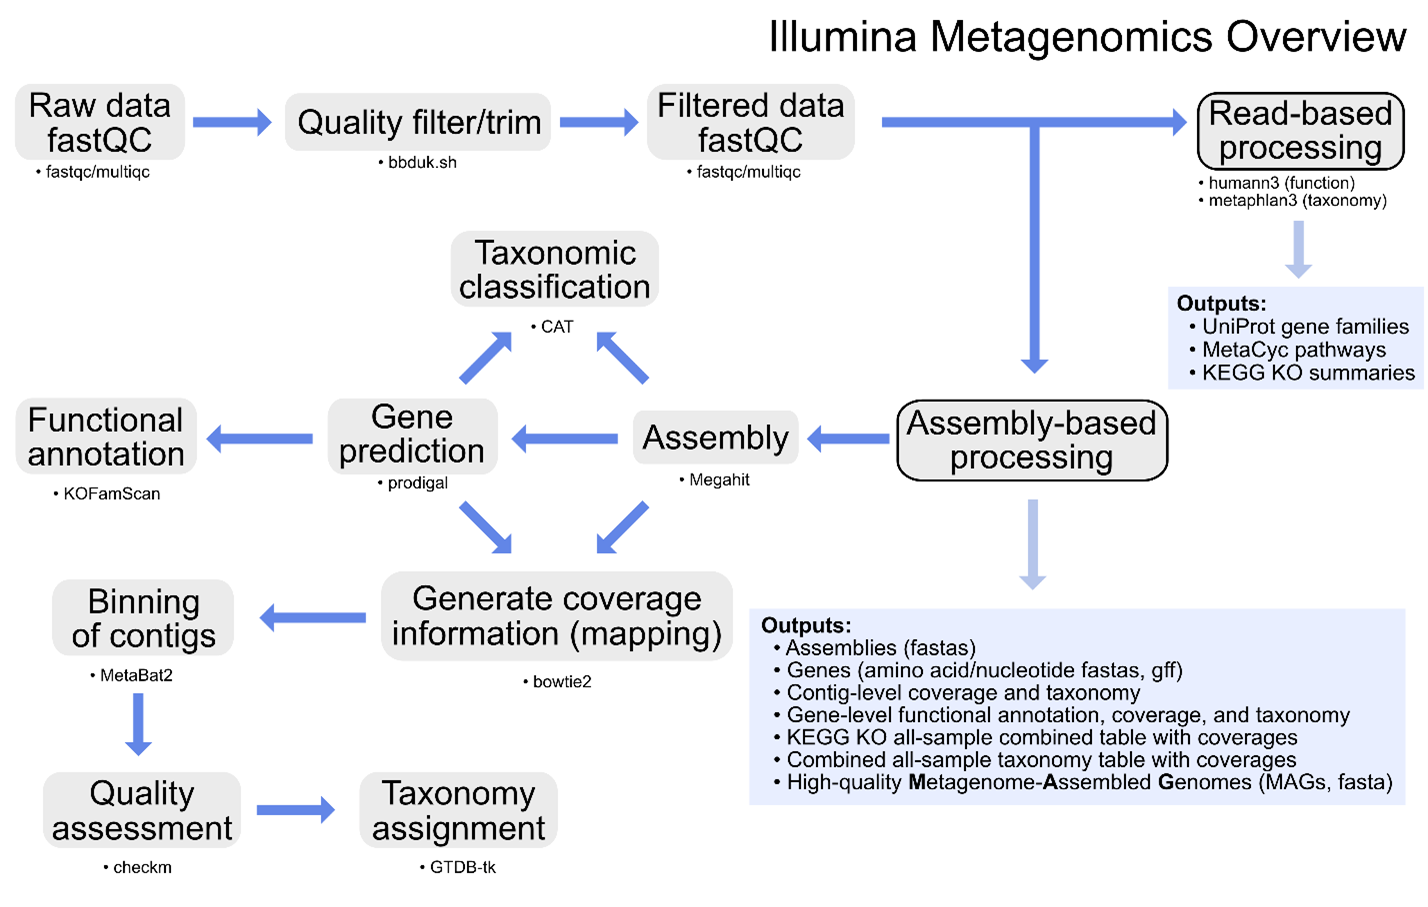
Additional information on metagenomics (and amplicon sequencing) can be found at Happy Belly Bioinformatics. The GeneLab metagenomics consensus processing pipeline is designed to identify taxonomic changes and functional potential in biological samples exposed to the space environment by processing raw shotgun metagenomic sequence data through contig-level taxonomic assignments, functional annotation, and recovery of MAGs as summarized in the diagram above.
Specific details of each step of the pipeline, including previous and current pipeline versions, are available on the Metagenomics page of the GeneLab DP GitHub Repository.
The primary data products and respective quality control (QC) analyses generated from each step of the pipeline, as described below, are available for each GeneLab metagenomics dataset hosted on the OSDR under ‘Study Files’. Note that all human reads are scrubbed from raw metagenomic sequence data prior to publishing on the OSDR. Below are the metagenomics data files that are published:
README
- *README.txt: A text file describing the output directory structure and data files
Raw sequence data and QC
- *HRremoved_raw.fastq.gz: Raw sequence data after human read removal, commonly referred to as raw reads
- *raw_multiqc_report.zip: Combined fastQC analyses and respective html report of raw sequence data
Filtered sequence data and QC
- *filtered.fastq.gz: Trimmed and quality-filtered sequence data, commonly referred to as filtered reads
- *filtered_multiqc_report.zip: Combined fastQC analyses and respective html report of trimmed and filtered sequence data
Assembly-based processing
- *Assembly-based-processing-overview.tsv: Table containing information about samples throughout the assembly-based processing
Assemblies
- *assembly.fasta: Contig-renamed assembled sequences
- *assembly-summaries.tsv: Table containing assembly summary statistics
Predicted-genes
- *genes.fasta: Recovered gene nucleotide sequences
- *genes.faa: Recovered gene amino acid sequences
- *genes.gff: Recovered gene calls in general feature format
Read-mapping
- *mapping-info.txt: Text file containing bowtie2 alignment info/stats
- *metabat-assembly-depth.tsv: Table containing quantification of contig coverage for each sample
- *.bam: Sequence alignment map containing reads mapping to the respective sample *assembly.fasta reference, sorted by coordinate, in binary format
Annotations-and-taxonomy
- *contig-coverage-and-tax.tsv: Table containing combined contig coverage and taxonomy info for each sample
- *gene-coverage-annotation-and-tax.tsv: Table containing combined gene coverage, annotation, and taxonomy info for each sample
Combined-outputs
- *Combined-contig-level-taxonomy-coverages.tsv: Table containing unnormalized coverage quantification of contigs across all samples, summed based on contig-level assigned taxonomy
- *Combined-contig-level-taxonomy-coverages-CPM.tsv: Table containing coverage quantification of contigs across all samples, summed based on contig-level assigned taxonomy, normalized as coverage per million (CPM)
- *Combined-gene-level-taxonomy-coverages.tsv: Table containing unnormalized coverage quantification of genes across all samples, summed based on gene-level taxonomic classifications
- *Combined-gene-level-taxonomy-coverages-CPM.tsv: Table containing coverage quantification of genes across all samples, summed based on gene-level assigned taxonomy, normalized as coverage per million (CPM)
- *Combined-gene-level-KO-function-coverages.tsv: Table containing unnormalized coverage quantification of Kyoto Encyclopedia of Genes and Genomes (KEGG) Orthology (KO) annotations across all samples, summed by KO identifier
- *Combined-gene-level-KO-function-coverages-CPM.tsv: Table containing coverage quantification of KO annotations across all samples, summed by KO identifier, and normalized as coverage per million (CPM)
Bins
- *bin.*.fasta: Recovered assembled metagenomic contig sequences grouped into bins believed to represent individual microbial populations
MAGs
- *MAG.*.fasta: High-quality MAGs recovered, if any, having greater than 90% estimated completeness and less than 10% estimated redundancy
- *MAGs-overview.tsv: Table containing information about each recovered MAG including general stats, quality estimates, and assigned taxonomy
- *MAG-level-KO-annotations.tsv: Table containing MAGs and their respective KO annotations
- *MAG-KEGG-Decoder-out.tsv: Table containing MAGs and their respective proportions of genes known to be required for specific pathways/metabolisms
- *MAG-KEGG-Decoder-out.html: Interactive heatmap html file representing the proportions of genes known to be required for specific pathways/metabolisms in recovered MAGs
Read-based processing
- *Gene-families.tsv: Table containing unnormalized gene-family quantification for all samples
- *Gene-families-grouped-by-taxa.tsv: Table containing unnormalized gene-family quantification grouped by taxa for all samples
- *Gene-families-cpm.tsv: Table containing gene-family quantification normalized as copies-per-million (CPM) for all samples
- *Gene-families-KO-cpm.tsv: Table containing KO term quantification normalized as copies-per-million (CPM) for all samples
- *Pathway-abundances.tsv: Table containing unnormalized pathway quantification for all samples
- *Pathway-abundances-grouped-by-taxa.tsv: Table containing unnormalized pathway quantification grouped by taxa for all samples
- *Pathway-abundances-cpm.tsv: Table containing pathway quantification normalized as copies-per-million (CPM) for all samples
- *Pathway-coverages.tsv: Table containing pathway coverages for all samples
- *Pathway-coverages-grouped-by-taxa.tsv: Table containing pathway coverages grouped by taxa for all samples
- *Metaphlan-taxonomy.tsv: Table containing metaphlan estimated taxonomic relative abundances for all samples
Processing info
- *processing_info.tar: Tarred file containing the exact processing information for each step of the pipeline