A collaboration between NASA GeneLab and the Gilroy Lab has led to a multi-omics, cross-species analysis of GeneLab omics data, creating a new NASA Space Biology sponsored investigation into the effects of spaceflight and microgravity simulations on plant-microbe interactions.
A suite of visualization tools to explore relationships between studies within the GeneLab data repository has been created by Richard Barker, a member of the Gilroy Lab at the University of Wisconsin, Madison, and co-lead of the GeneLab Plant Analysis Working Group (AWG). These apps aggregate diverse data types and allow users to find associations between the distinct GeneLab accessions. This has allowed the identification of new correlations in the data leading to the generation of novel hypotheses and the creation of protocols for experimental validation.
 GeneLab X-Species Metadata – API-linked, GeneLab meta-data visualization that allows for the identification of links between studies with related meta-data fields.
 TOAST - The AstroBotany multi-plant species and multi-omics explorer featuring microarray, RNAseq, epigenetics and proteomic data.
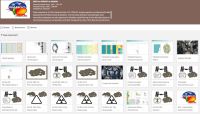 MANGO ISS MicroBiome - Explorer for the ISS microbiome and Microbial Observatory data: indoor microbiome study of the ISS surfaces and the ISS dust particle microbiome.
 Rad-Bio App - Explorer for space radiation exposure experienced by each GeneLab experiment.
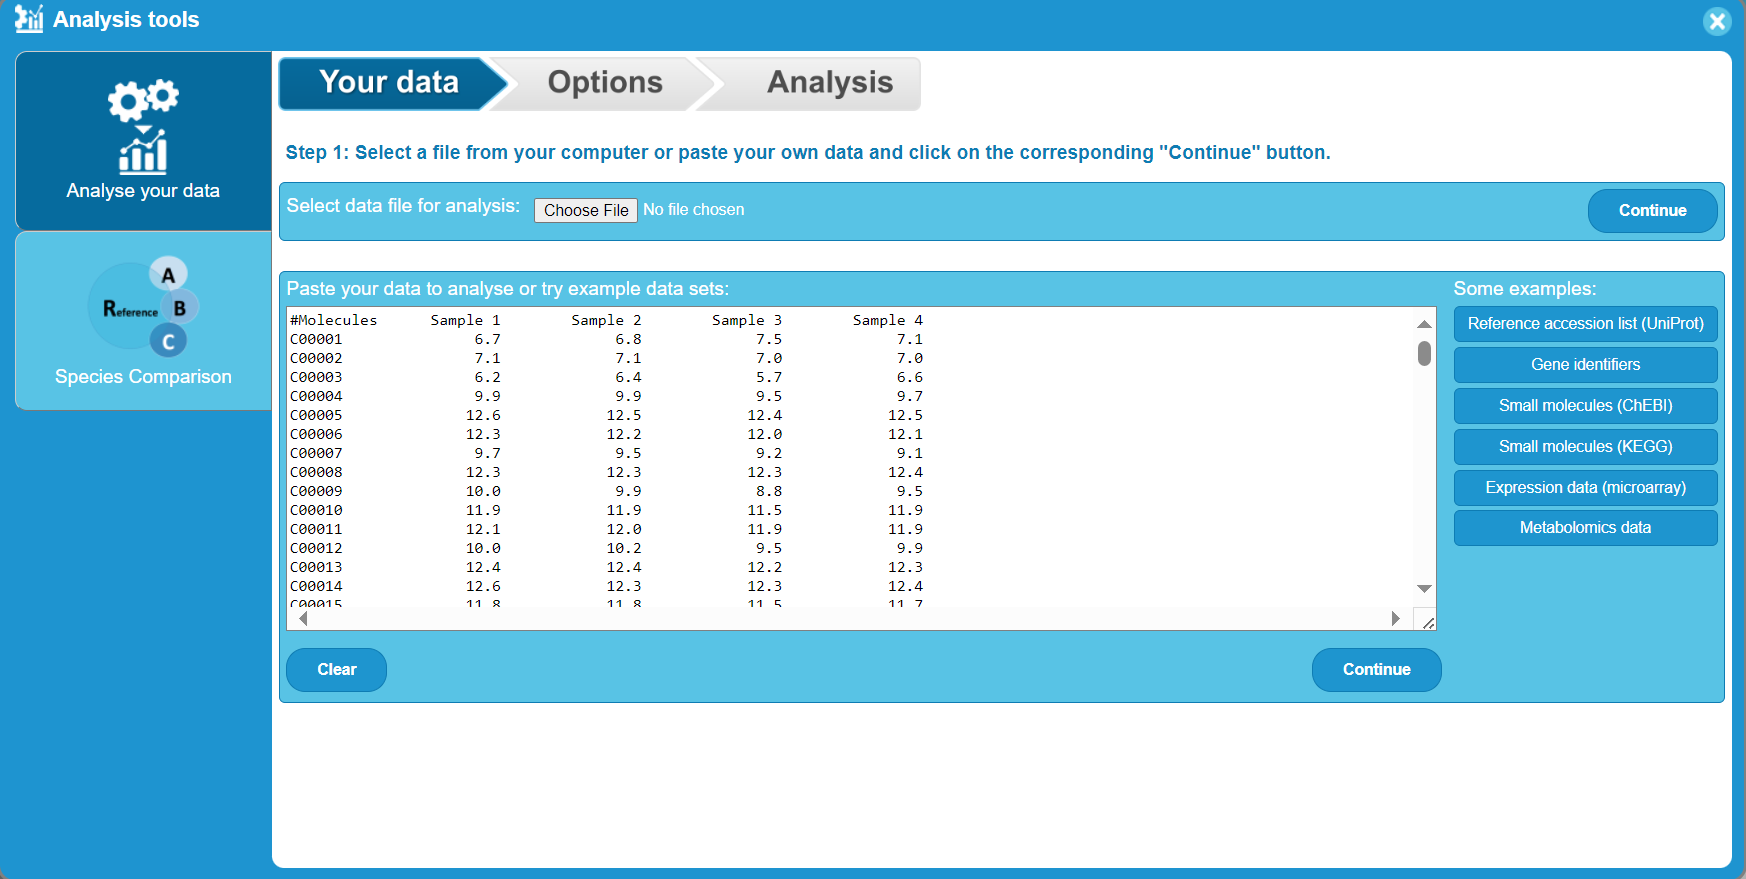
The Plant Reactome is an all-inclusive resource of plant pathways for basic research, genome analysis, pathway modeling, systems biology, and education. This is an open-source, open access, manually curated and peer-reviewed pathway database with the goals of conveying the rich information in the visual representations of plant pathways in a detailed, computationally accessible format. Pathway annotations are authored by expert biologists, in collaboration with the Reactome editorial staff and cross-referenced to many bioinformatics databases. These include project databases like Gramene, Ensembl, UniProt, ChEBI small molecule databases, PubMed, and Gene Ontology. The Plant Reactome resource provides an intuitive website to navigate pathway knowledge and a suite of data analysis tools to support the pathway-based analysis of complex experimental and computational data sets. So, come and check out this new resource!
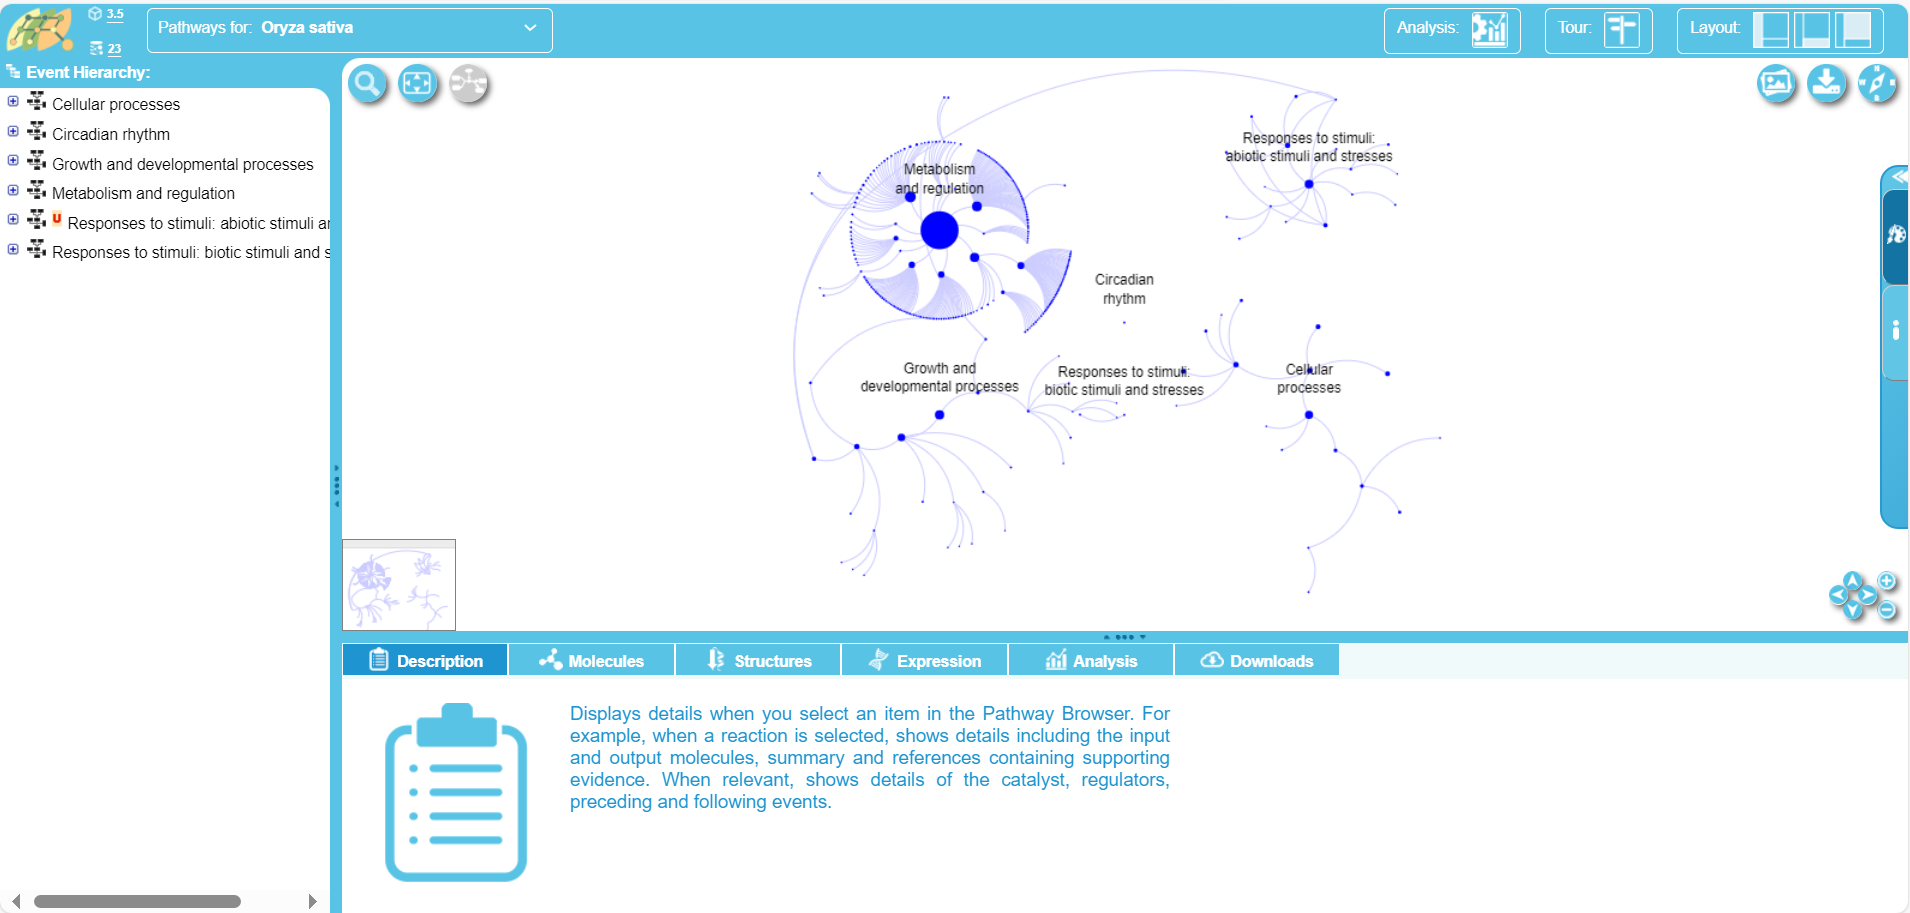 Pathway Browser – Visualize and interact with Plant Reactome biological pathways