BION-M1 Radiation Dosimetry
Launch: 1000 UT 4/19/2013 (Baikonur, Kazakhstan)
Landing: 0312 UT 5/19/2013 (Orenburg region, Russia)
Orbit: apogee 585 km; perigee 555 km; inclination 65 deg
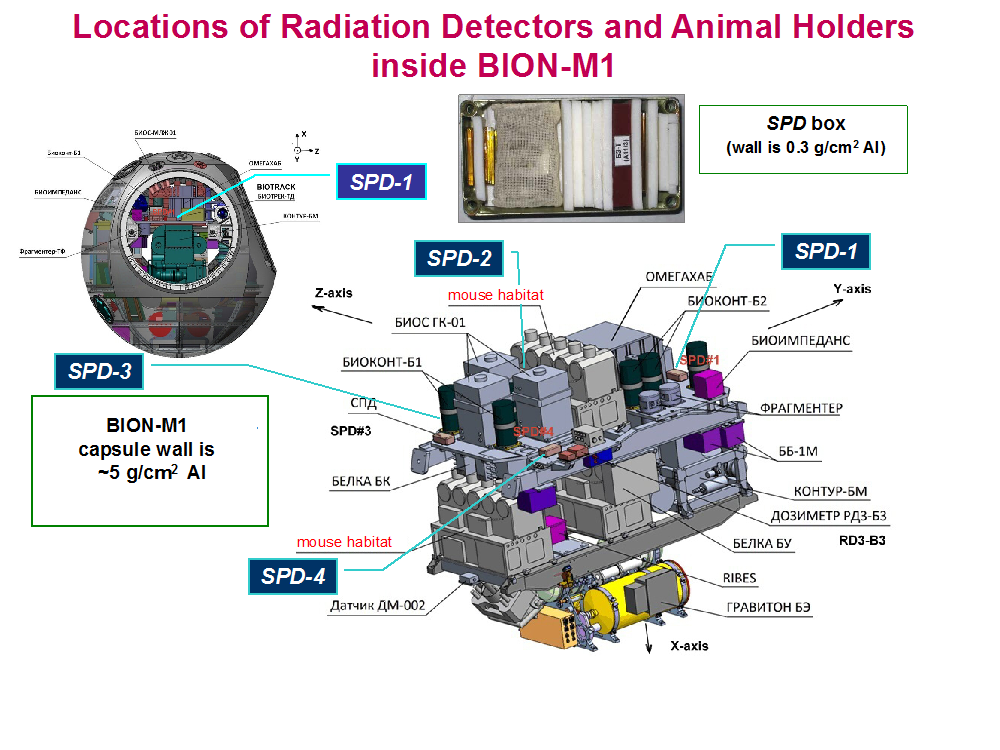
Detectors:
SPD1-41 Passive (thermoluminescent dosimeters, plastic nuclear track detectors) — charged particles
RD3-B32 Active (solid state, Liulin-type) — charged particles
(Operated 4/19-5/13)
Note: Tissues were obtained from surviving mice from the three animal habitats. Advise that data be used as averages and upper and lower bounds for radiation exposure.
Note: The absorbed doses are typically measured with a high degree of precision. However due to confounding factors, in particular the differences in local shielding around the payload and around the instrument, unless otherwise noted the doses to the payload should be considered to be accurate to within ~10%, based on known variations to the radiation dose across ISS modules.
SPD data1
| Avg. Abs. Dose D (μGy/day |
Abs. Dose (mGy)2 |
|||||
|---|---|---|---|---|---|---|
| SPD | Low LET | High LET | Total | Low LET | High LET | Total |
| 1 | 1267 | 151 | 1418 | 37.82 | 4.507 | 42.33 |
| 2 | 546 | 84 | 630 | 16.30 | 2.507 | 18.81 |
| 3 | 713 | 112 | 825 | 21.28 | 3.343 | 24.63 |
| 4 | 1008 | 141 | 1149 | 30.09 | 4.209 | 34.30 |
1 From I. Ambrožová et al., Radiat. Meas. 106 (2017) 262-266.
2 Exposure duration was 29.85 days.
Notes:
- Low LET D measured with TLD
- High LET D and H measured with PNTD
RD3-B3 data3
| Avg. Abs. Dose D (μGy/day) |
|||
|---|---|---|---|
| Total | GCR | IRB (SAA) | ORB |
| 985 | 102.8 | 908 | 4.2 |
3 From T. Dachev et al., J. Atmos. Solar Terr. Phys. 123 (2015) 82-91.
Notes:
- GCR = galactic cosmic ray charged nuclei
- IRB (SAA) = inner radiation belt (South Atlantic Anomaly)
- ORB = outer radiation belt
- Total (GCR+IRB+ORB) is somewhat greater than total, due to overlap in selection criteria (as defined in Dachev et al.)