This year, the Open Science Data Repository (OSDR) team has made great strides in developing new visualization applications aimed at providing additional information for space biology research and analysis needs. These applications are now accessible on OSDR, and we invite you to explore their functionalities firsthand.
Multi-Study Visualization Platform
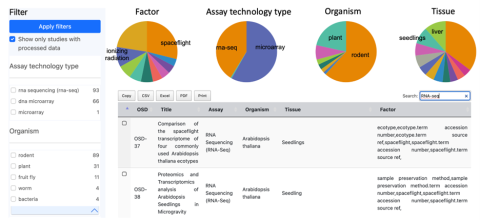
The Multi-Study Visualization Platform provides the capability to visualize multiple RNA sequencing datasets at the same time. Users can search through all datasets on OSDR and filter datasets by experimental factor, assay technology type, organism, and tissue type, and can also view all datasets that contain processed data for visualization. After selecting multiple RNA sequencing datasets for combining, users have the option to normalize the merged data using DESeq2 Median of Ratios. Additional factors can be selected after viewing the normalized and unnormalized PCA plots. The visualization page displays pair plots, volcano plots, gene set enrichment analysis, and differential gene expression. Future updates to this platform will include additional assays such as single cell RNA sequencing and metagenomics.
Environmental Data Application
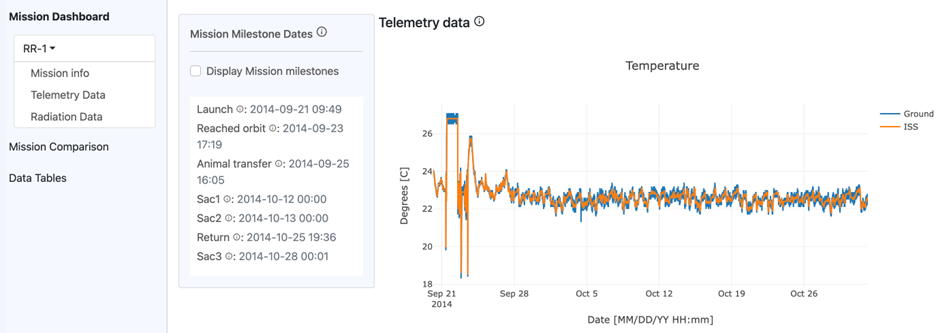
The Environmental Data Application provides the capability to visualize telemetry and radiation data collected on the International Space Station and corresponding ground platforms during the Rodent Research missions. Telemetry data includes temperature, relative humidity, and CO2 levels. Radiation data includes galactic cosmic rays, South Atlantic Anomaly, accumulated radiation dose, and total radiation dose. The application allows users to view single missions, compare two missions, and view and download summary or full data tables.
RadLab Portal and RadLab Data API
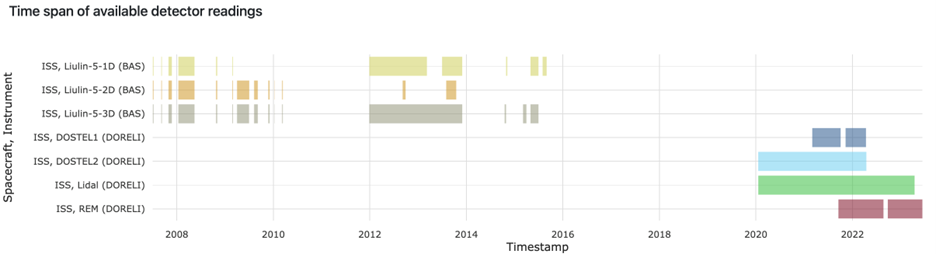
The RadLab Portal and RadLab Data API provides access to radiation telemetry data from multiple databases maintained by multiple space agencies. The Web interface provides the ability to query, visualize, inspect, and download data; for example, time series plots of readings from multiple radiation detectors, pairwise comparisons of detector readings, and geospatial visualizations of radiation dose and flux registered by the detectors. The demo version of RadLab contains the data obtained from four detectors included in the DORELI project (DOSTEL1, DOSTEL2, Lidal, REM; Italian Space Agency) and the data from three Liulin-5 detectors (Bulgarian Academy of Sciences). All seven detectors are/were located on the International Space Station (ISS). The RadLab Data API enables data selection and retrieval at a programmatic level.